A journey through a PhD
Contents
Introduction
Getting in the door was the hardest part of the whole ordeal. I did an undergrad at a university that doesn’t even show in the global rankings. At the time, I didn’t know about the importance of attending a good uni, so I focused on learning as much as I could during my undergrad, and a bit beyond what I was taught. After finishing my undergrad, I applied for master’s programmes, but I got rejection after rejection. The cycle of applications and rejections continued for almost four years, until at some point I became so tired of the rejections that decided to teach myself what I wanted to learn in the first place. 1 This went on until a global pandemic hit and a door opened (or rather, it became ajar), and I busted right in.
My PhD began on Friday, 13 August 2021: shortly after finishing an MSc in mathematics living through a global pandemic, and participating in the 2021 Google Summer of Code. I met Alex, my first PhD supervisor, in a course in Bayesian statistics during my MSc and I met Kevin, my second PhD supervisor, through an email that started because I was bored during the pandemic and I decided to close Github issues in his repo to pass the time.
When I first started my PhD, I didn’t know what to expect. I didn’t know about research or academia. I didn’t even know you could get paid (even if little) to do research. I simply wanted to explore the space of ideas I was interested in. Lucky for me, I had the immense guidance of my supervisors, and brilliant friends and colleagues who supported me throughout the PhD. By the end, I published more than I expected, presented at conferences that once felt out of reach, worked on ideas that mattered to me, and got to collaborate with people far smarter than me. All things considered, it wasn’t much, but it was honest work.
Almost a year after finishing the PhD, I wanted to reflect on that period of my life. Memory alone, however, is not a reliable way to reconstruct the past. 2 Thankfully, I had the questionable habit of tracking every second of my working day, which I kept for the four years or so it took me to get the degree. 3
Thus, what follows is a reconstruction of my PhD: part memory, part dataset — lessons learned, and experiences lived.
The dataset I analyse in this post spans 13 August 2021 to 30 May 2025, when I received my degree.
A bird’s eye view of my PhD
My golden rule while doing this four-year-long experiment was simple: to track time only when working. This excludes time spent chatting with friends and colleagues, having lunch, going for walks, attending meetings that were really office gossip in disguise, or rerunning the same script with different random seeds for the tenth time to look busy. I tried as best to count only productive hours, i.e., hours in which I was deliberately doing work.
With that definition in place, the simplest bird’s-eye view of my PhD is a time series: productive hours per day.
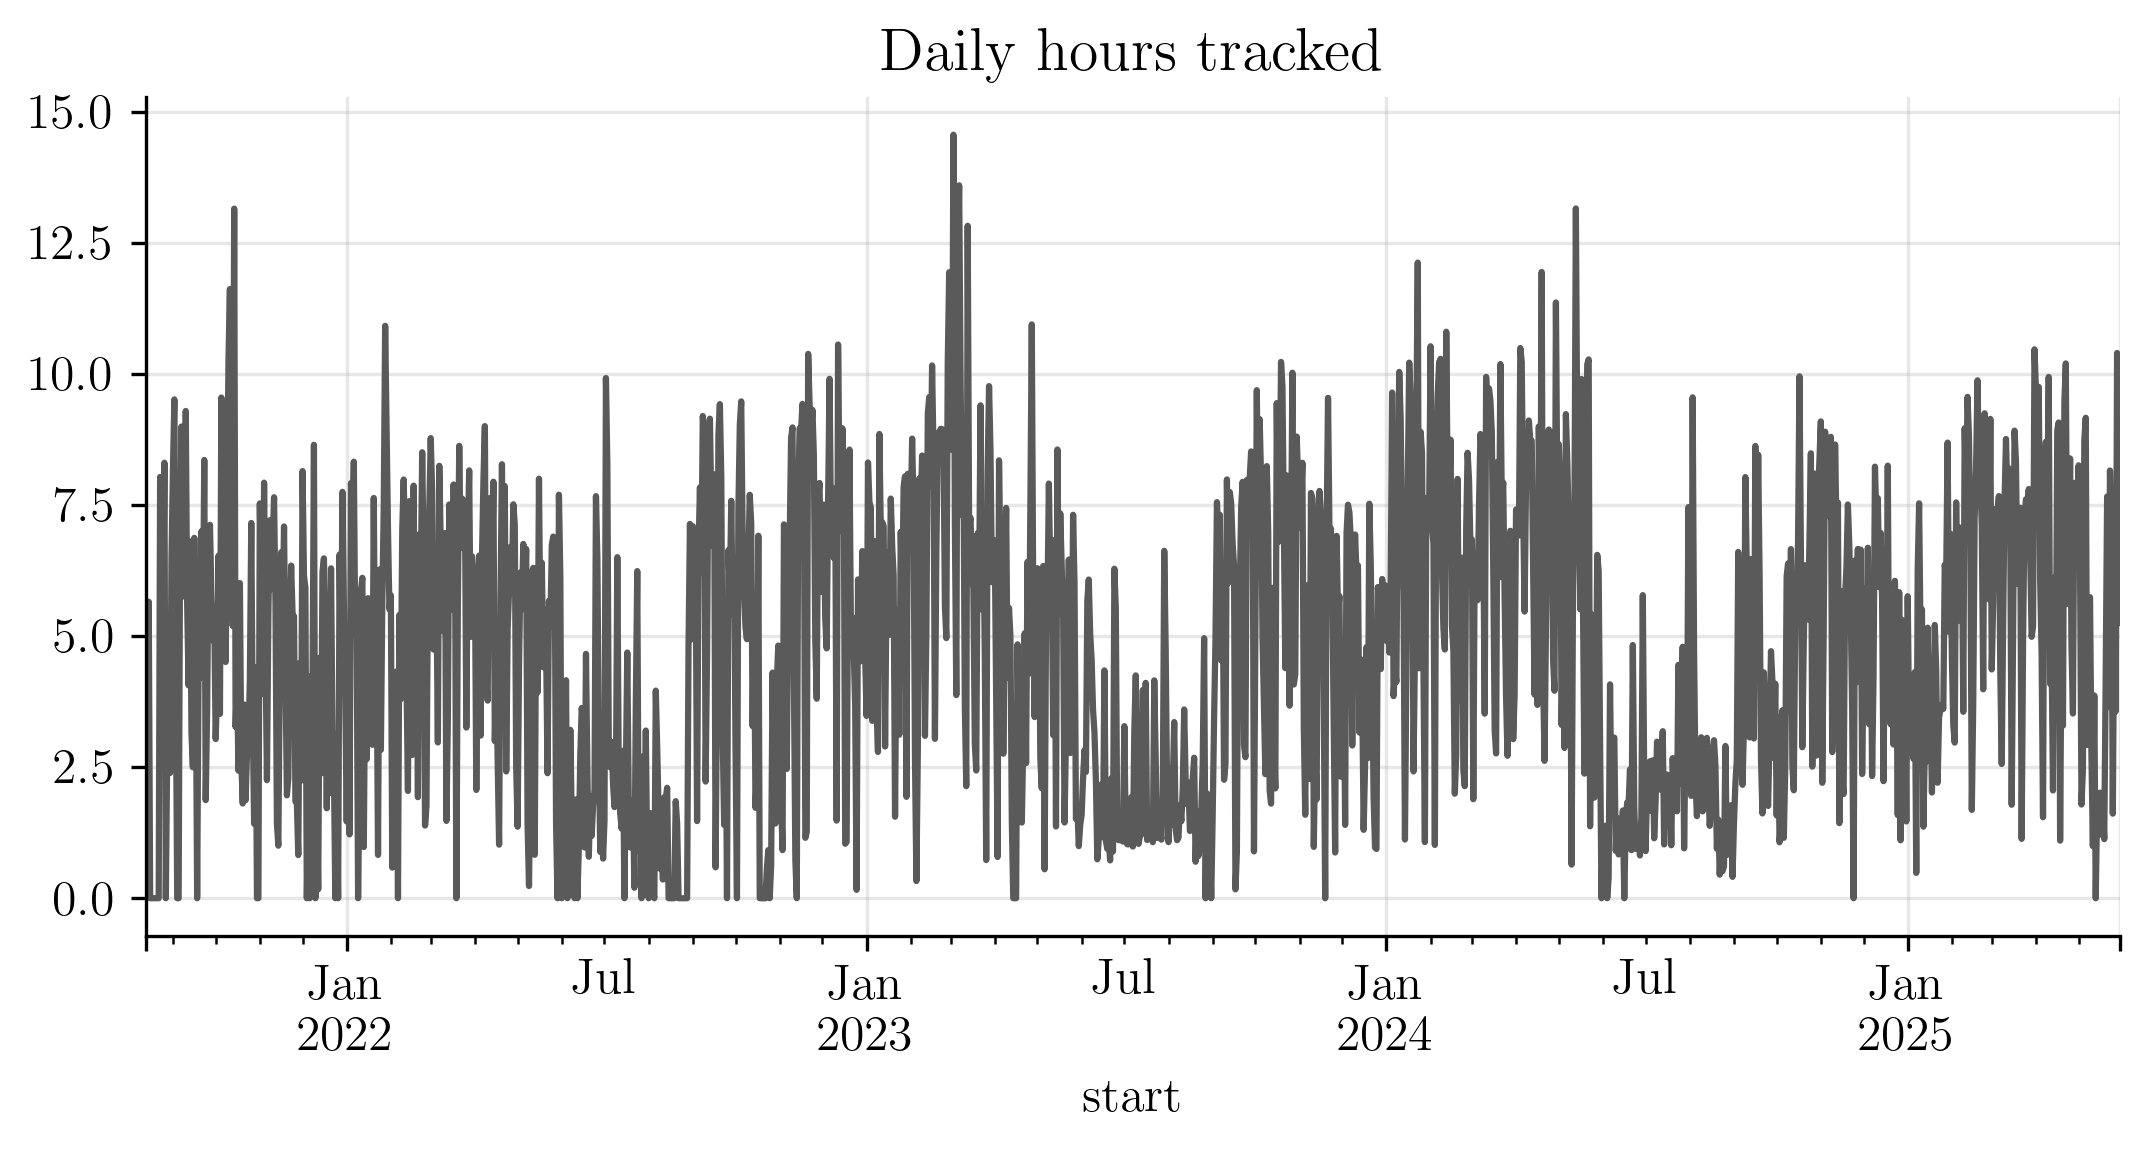
The series shows clear dips during the summer months and some peaks during winter times (especially around each end of year).
In addition to tracking how much I worked every day, I classified each logged hour into one of several categories: research, meetings, studying, etc. The pie chart below shows the distribution of my time across these categories.
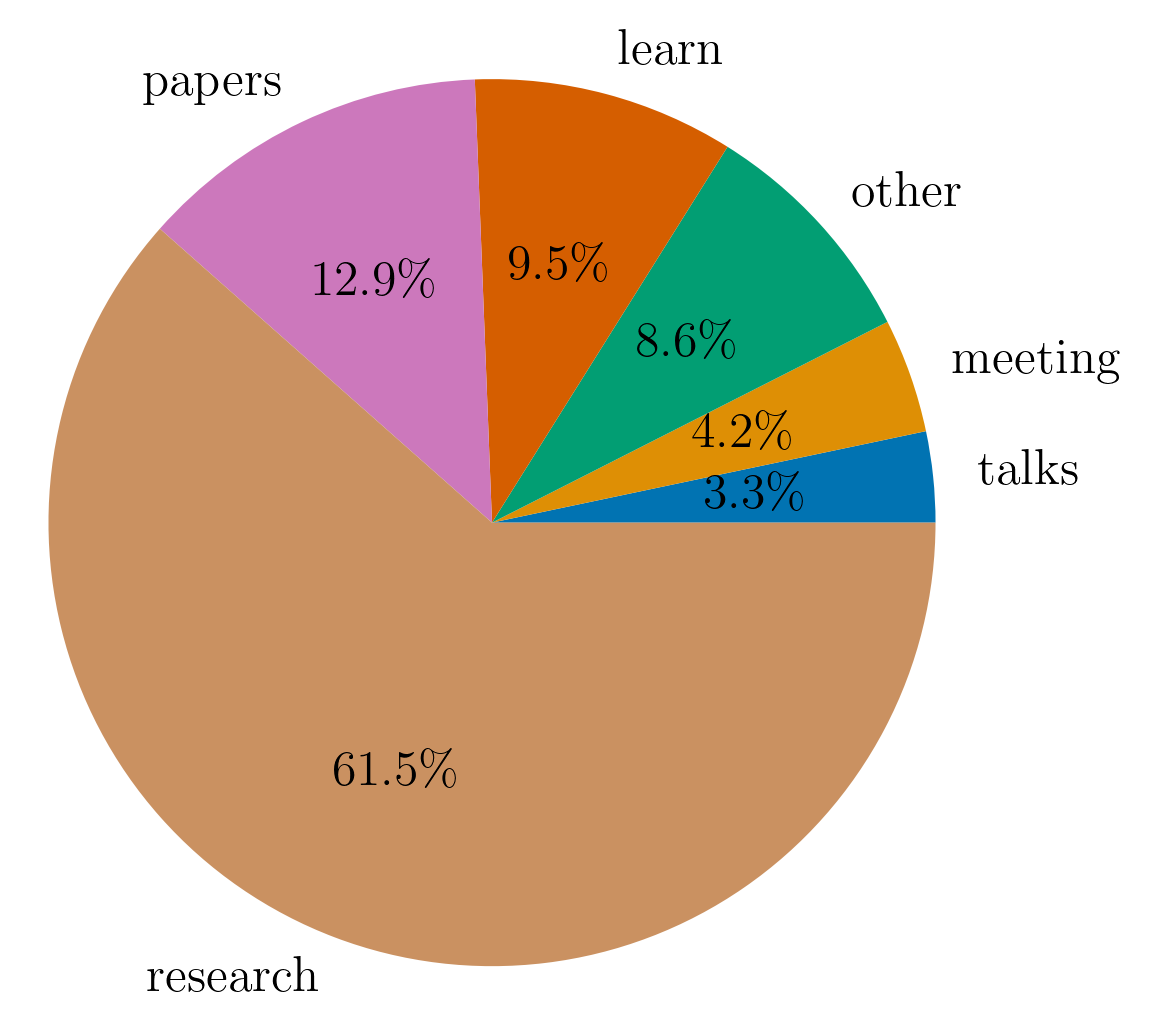
Unsurprisingly, most of my time was spent doing research. This includes working through maths, running an experiment, replicating a method, or reading papers. All of it ultimately aimed at writing a paper.
The next category is papers. This category is for papers that I read for mere curiosity rather than for the explicit purpose of including it in research. In reality, this underestimates the time spent reading papers, since much of what I label as research also involved understanding and comparing prior work.
The category, learn, includes reading books, attending courses, and watching lectures to build background knowledge.
The remaining time was distributed among meetings, giving or attending talks and other administrative tasks.
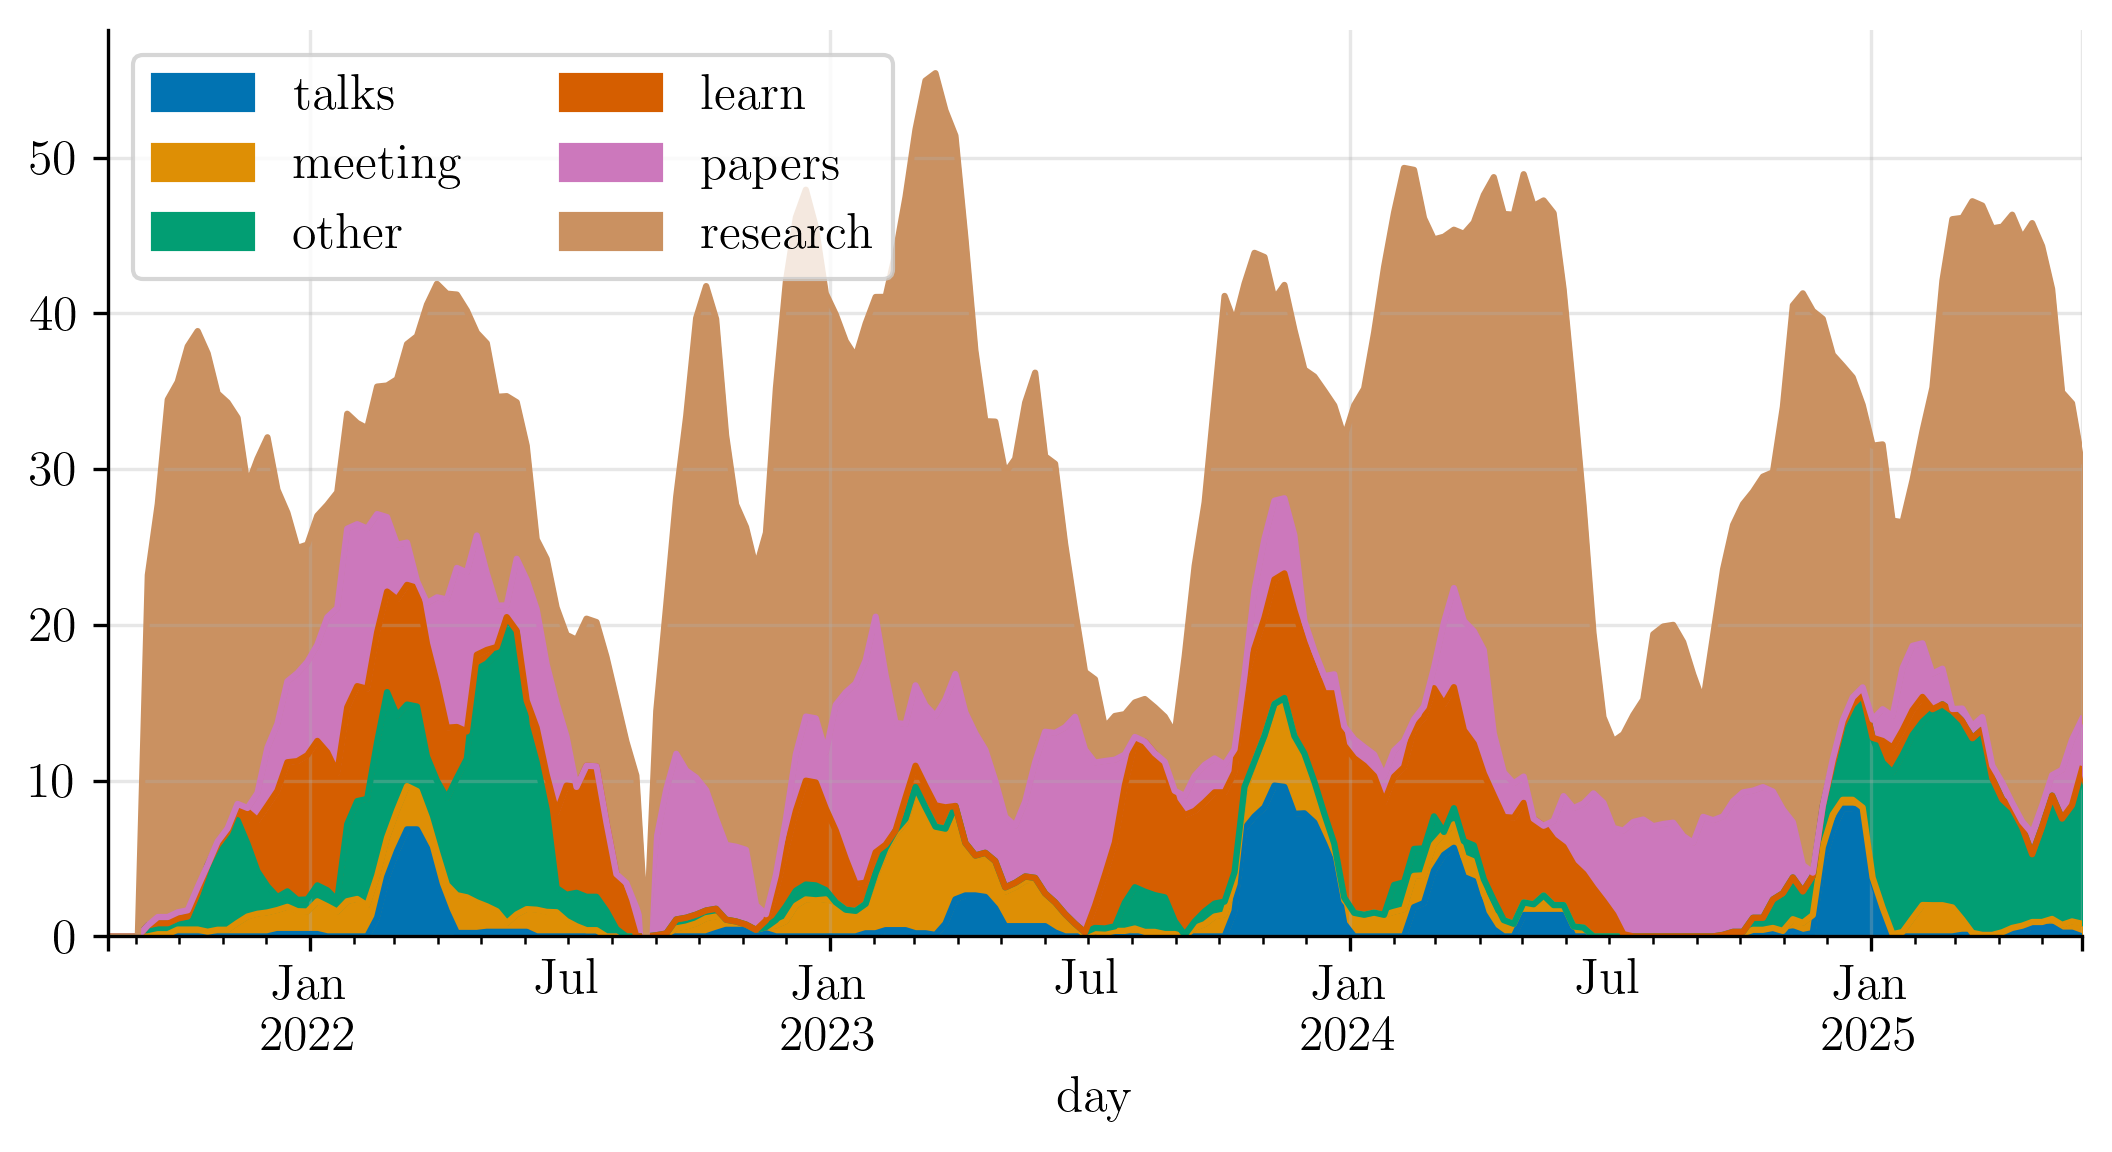
Finally, the plot below shows that both the intensity and the composition of my work varied over time. It shows an exponentially-weighted moving average of productive hours per category across the PhD. The relative proportions remained broadly stable, with temporary shifts during specific periods.
A typical working week
If we take worked hours as a proxy for productivity, daily productivity reduces to worked hours per day.
No two days are identical; some are more productive than others. Thus, to characterise a typical day, I estimated a survival curve of worked hours, stratified by weekday (shown below). The x-axis shows hours worked; the y-axis shows the proportion of days on which I worked at least that many hours.
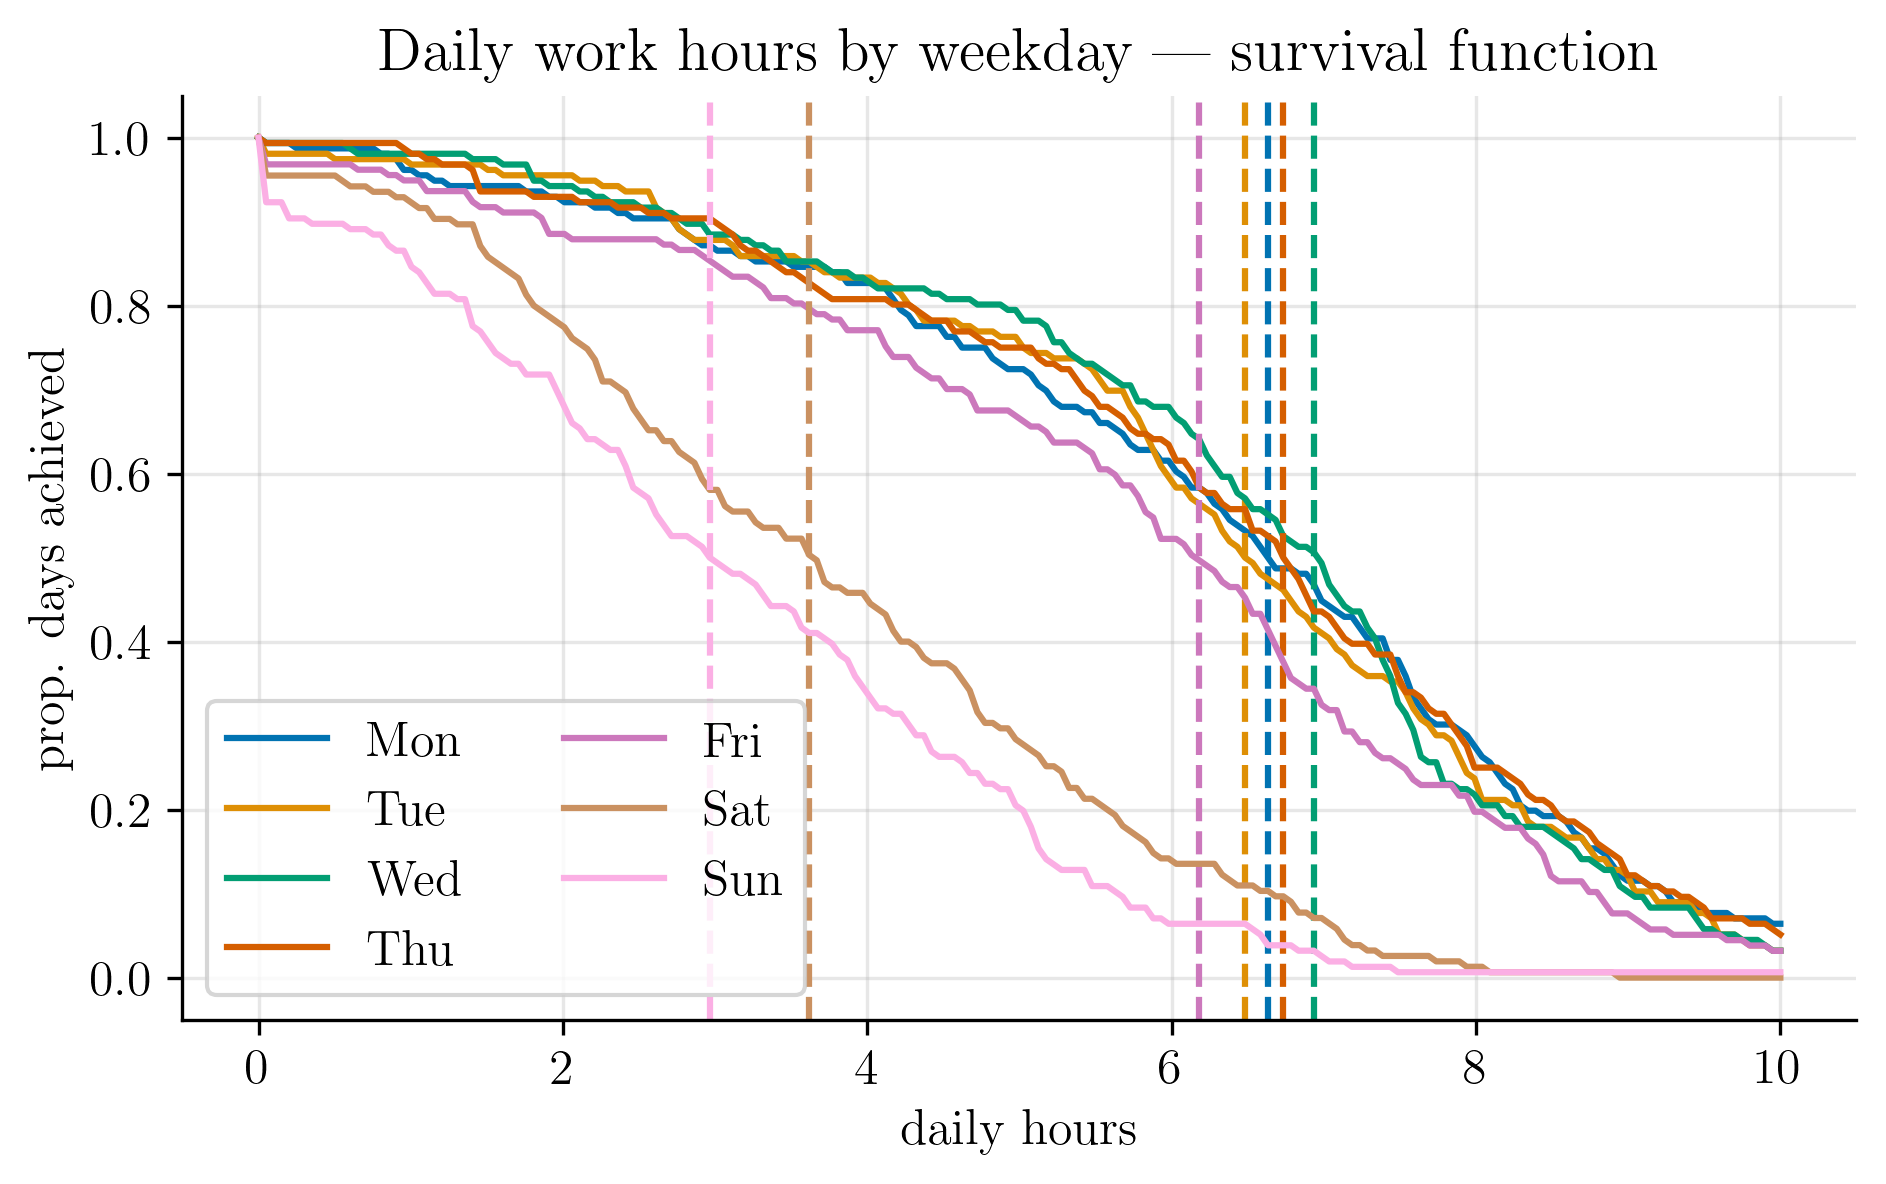
In an ideal world, the survival curve would remain flat up to some target and then drop sharply. Interpreting the slope of the curve as the risk of stopping work, a steeper decline implies a higher chance of calling it a day. Weekends clearly carry the highest risk, while weekdays are relatively stable.
The dashed vertical lines mark the median number of hours worked per weekday. For the purposes in this post, this answers a simple question: how many hours did I work on a typical day?4
Sundays were my least productive, though I usually managed some light reading or study. Wednesdays were my most productive.
The next plot shows the median worked hours by weekday along with the interquartile range.
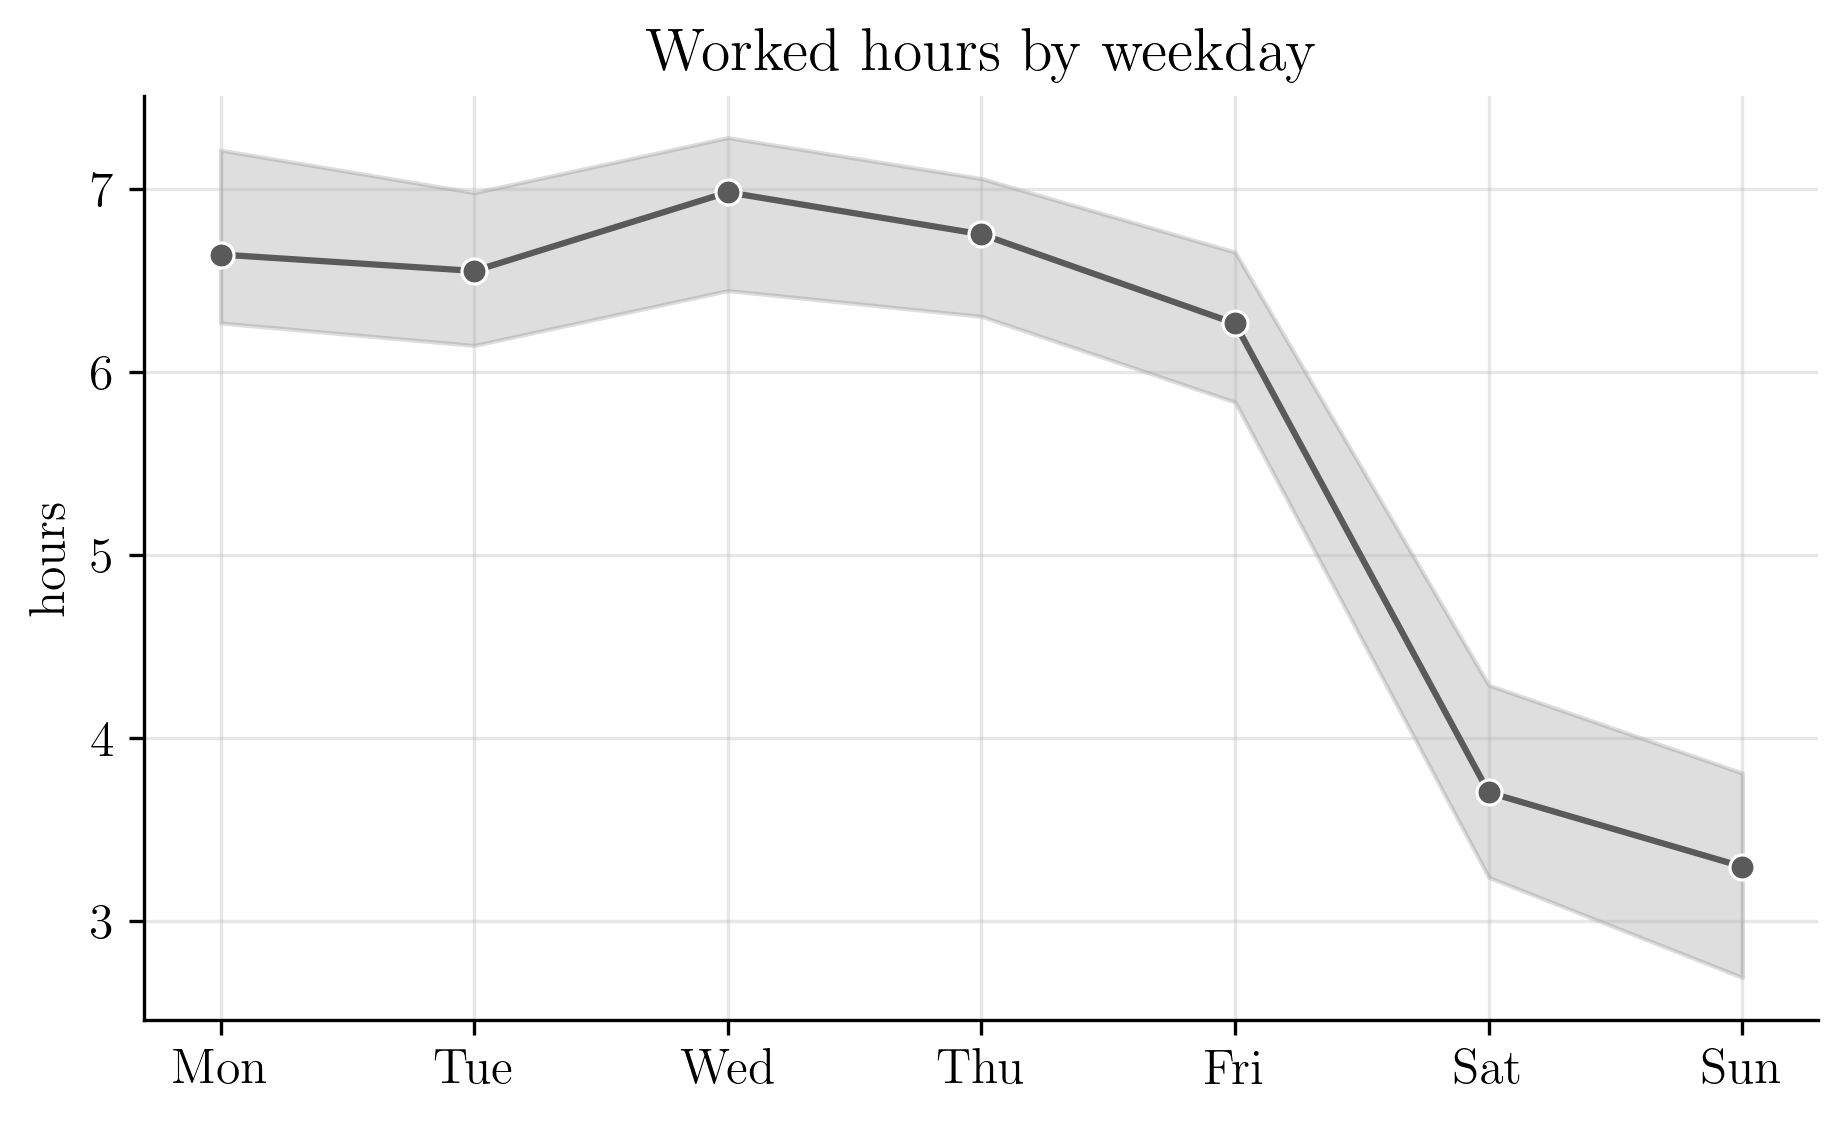
Mondays and Tuesdays were consistent, followed by a small uptick on Wednesday, after which both median hours decline and variability increases toward the weekend.
Working day by the hour
I’m certain of one thing: I’m a morning person. I’m most productive shortly after waking up.
The plot below supports this. It shows the average number of worked hours as a function of the hour of the day.
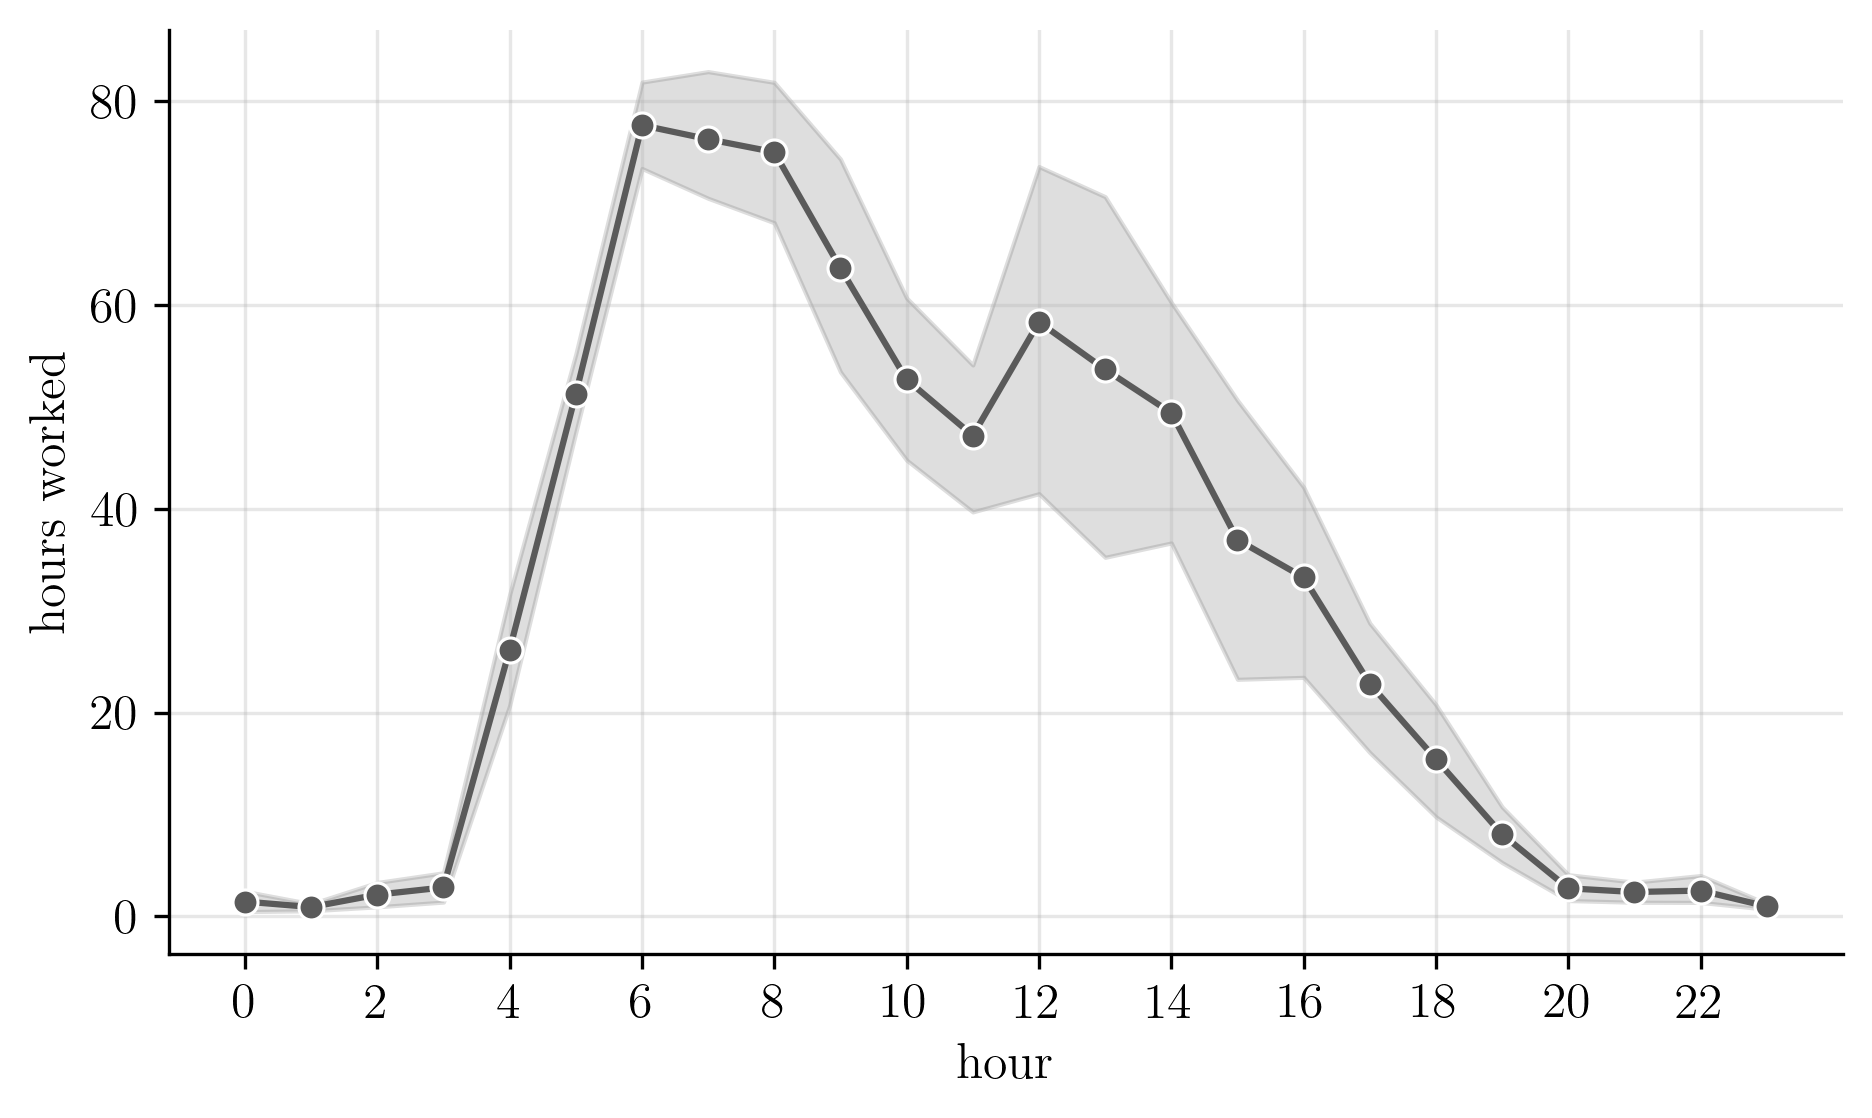
Most work was done in the early morning hours, after which productivity decreases almost monotonically. Around noon there is a brief attempt at revival (I tend to eat lunch quickly), but it is short-lived. By 8pm, I was usually at the gym or waiting for 10pm to go to bed.
Cumulatively, I worked more hours at 5am than at any hour after 2pm.
How many hours a week, really?
Every so often, I read about hyperproductive people who self-report working 80 to 100 hours a week. Some even claim 120 hours. 5 6 7
Based on the numbers shown earlier, there is no possible way I reached those totals. By the end of a long day (or week), my brain is fried and it becomes hard to get meaningful work done. And that’s before accounting for the small, unglamorous tasks that quietly consume time: dishes, laundry, the gym, or spending a weekend with friends and family.
But my story of productivity changes dramatically if I redefine as what counts as a working day. Suppose instead that hours worked are measured as the time between the first entry and the last entry.
Now we have two definitions:
- Version 1 — total productive hours (
productive hour). - Version 2 — time between between first and last log (
inter hour).
The two definitions are shown in the distribution below. The solid vertical lines mark the medians, the ticks at the bottom represent number of hours work in a week.
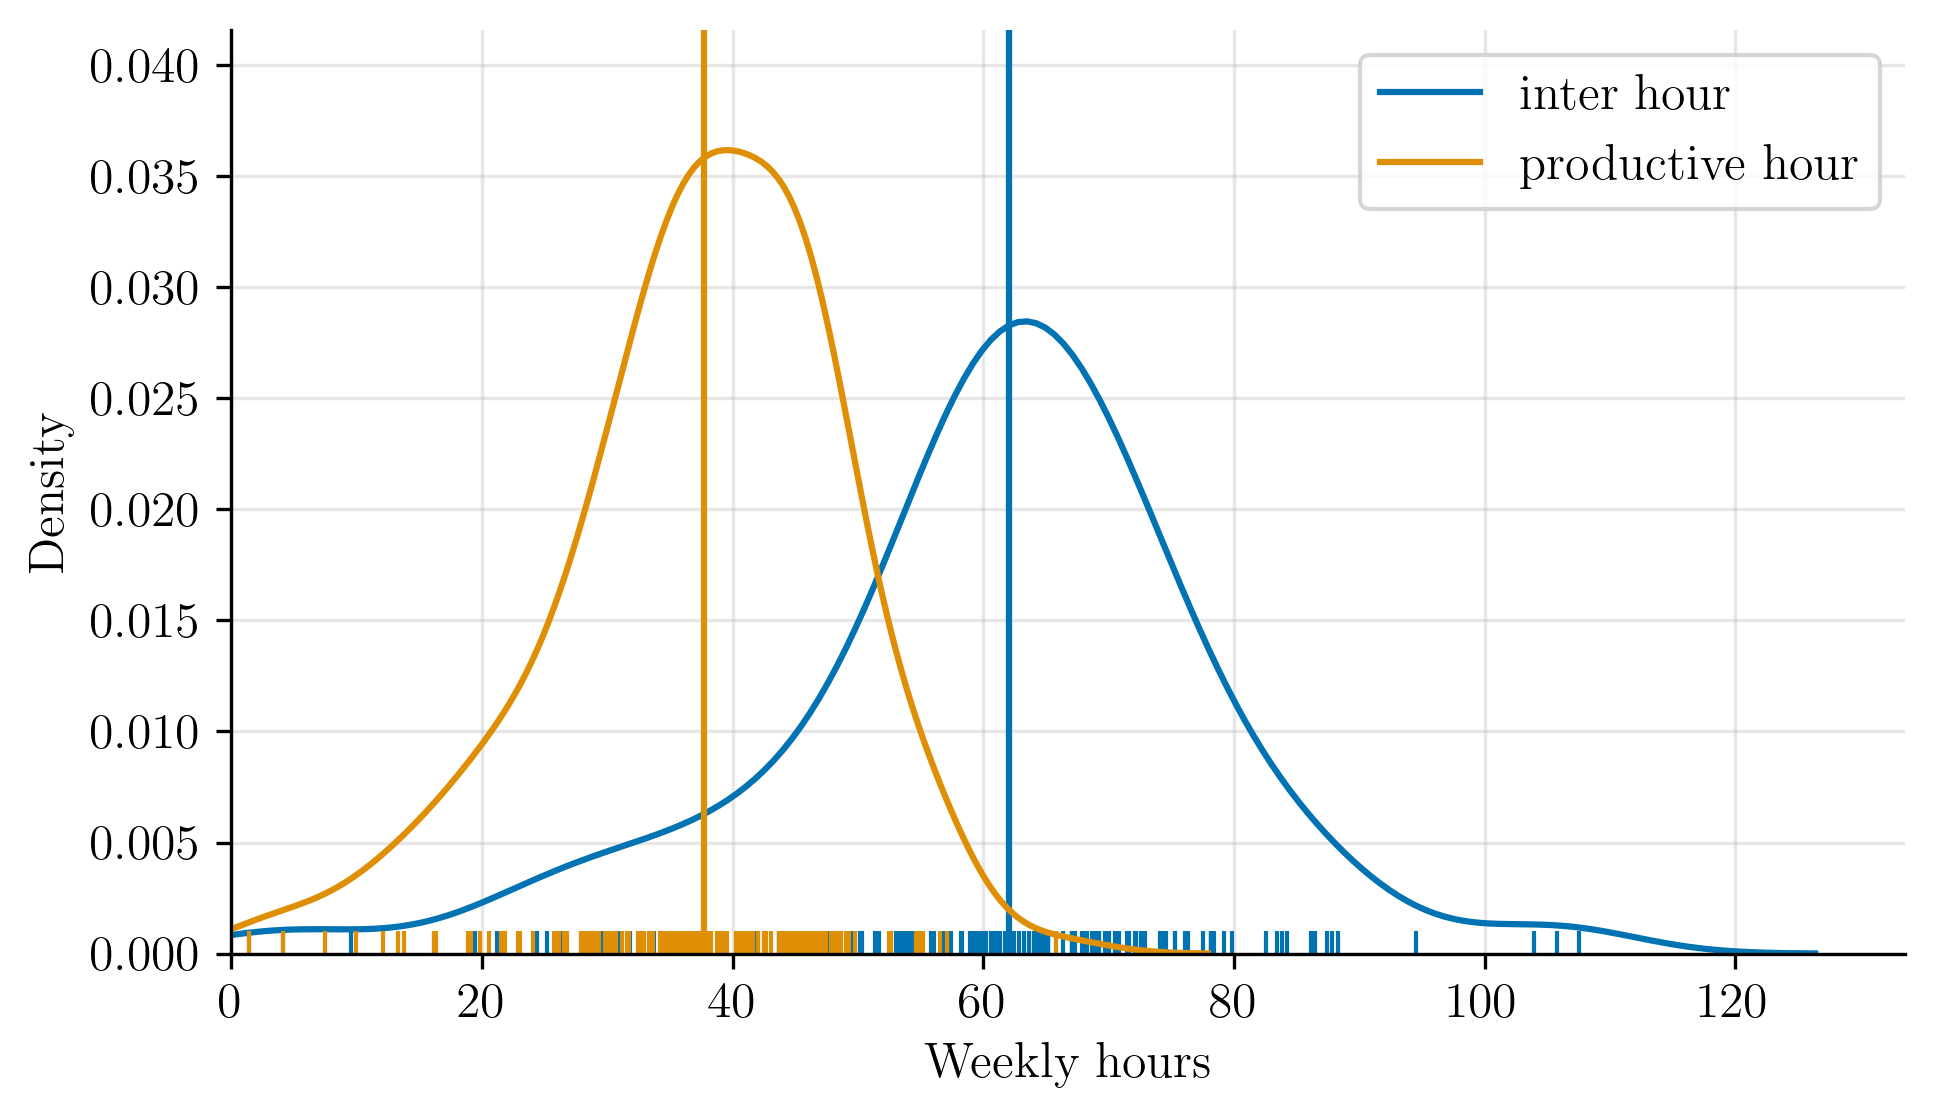
There is a clear 20-hour gap between the median productive hour total
and the median inter hour span.
Under the second definition, approaching 80 hours is almost trivial:
start early, finish late, stretch the day.
Read a paper before 8am. Go to the gym. Walk to the office. Work a few focused hours interspersed with breaks: a Youtube video here, a conversation there. Spend the afternoon in meetings, even if you’re only nodding in the background. Get home at 8pm and run one last experiment. Congratulations, you’re now hyperproductive.
But time alone says little about what actually happens during a PhD. As a friend once put it, it’s not how long you work, it’s what what you do during that time that matters. And for me, that usually meant doing research: iterating ideas, running experiments, and publishing work.
Research: where ideas come to live and die
For better or worse, the unwritten goal of a PhD in statistics or machine learning is to write papers. And to write a paper, you need an idea.
Something I learned the hard way is that most ideas fall into one of four categories:
- It already exists.
- It is not as novel as you thought.
- It does not work, and you do not know why, even though in theory it should.
- It is far harder than expected, which is often the reason you were drawn to it in the first place.
This is where good supervision matters. Supervisors should help steer research away from these traps and toward a coherent, publishable contribution.
I was fortunate to have supervisors who guided me closely through the first paper and gradually gave me more independence as the PhD progressed. Over time, I learned to conduct thorough literature reviews, accept that ideas fail, and iterate quickly. Alex and Kevin, if you’re reading this, tip of the hat to you.
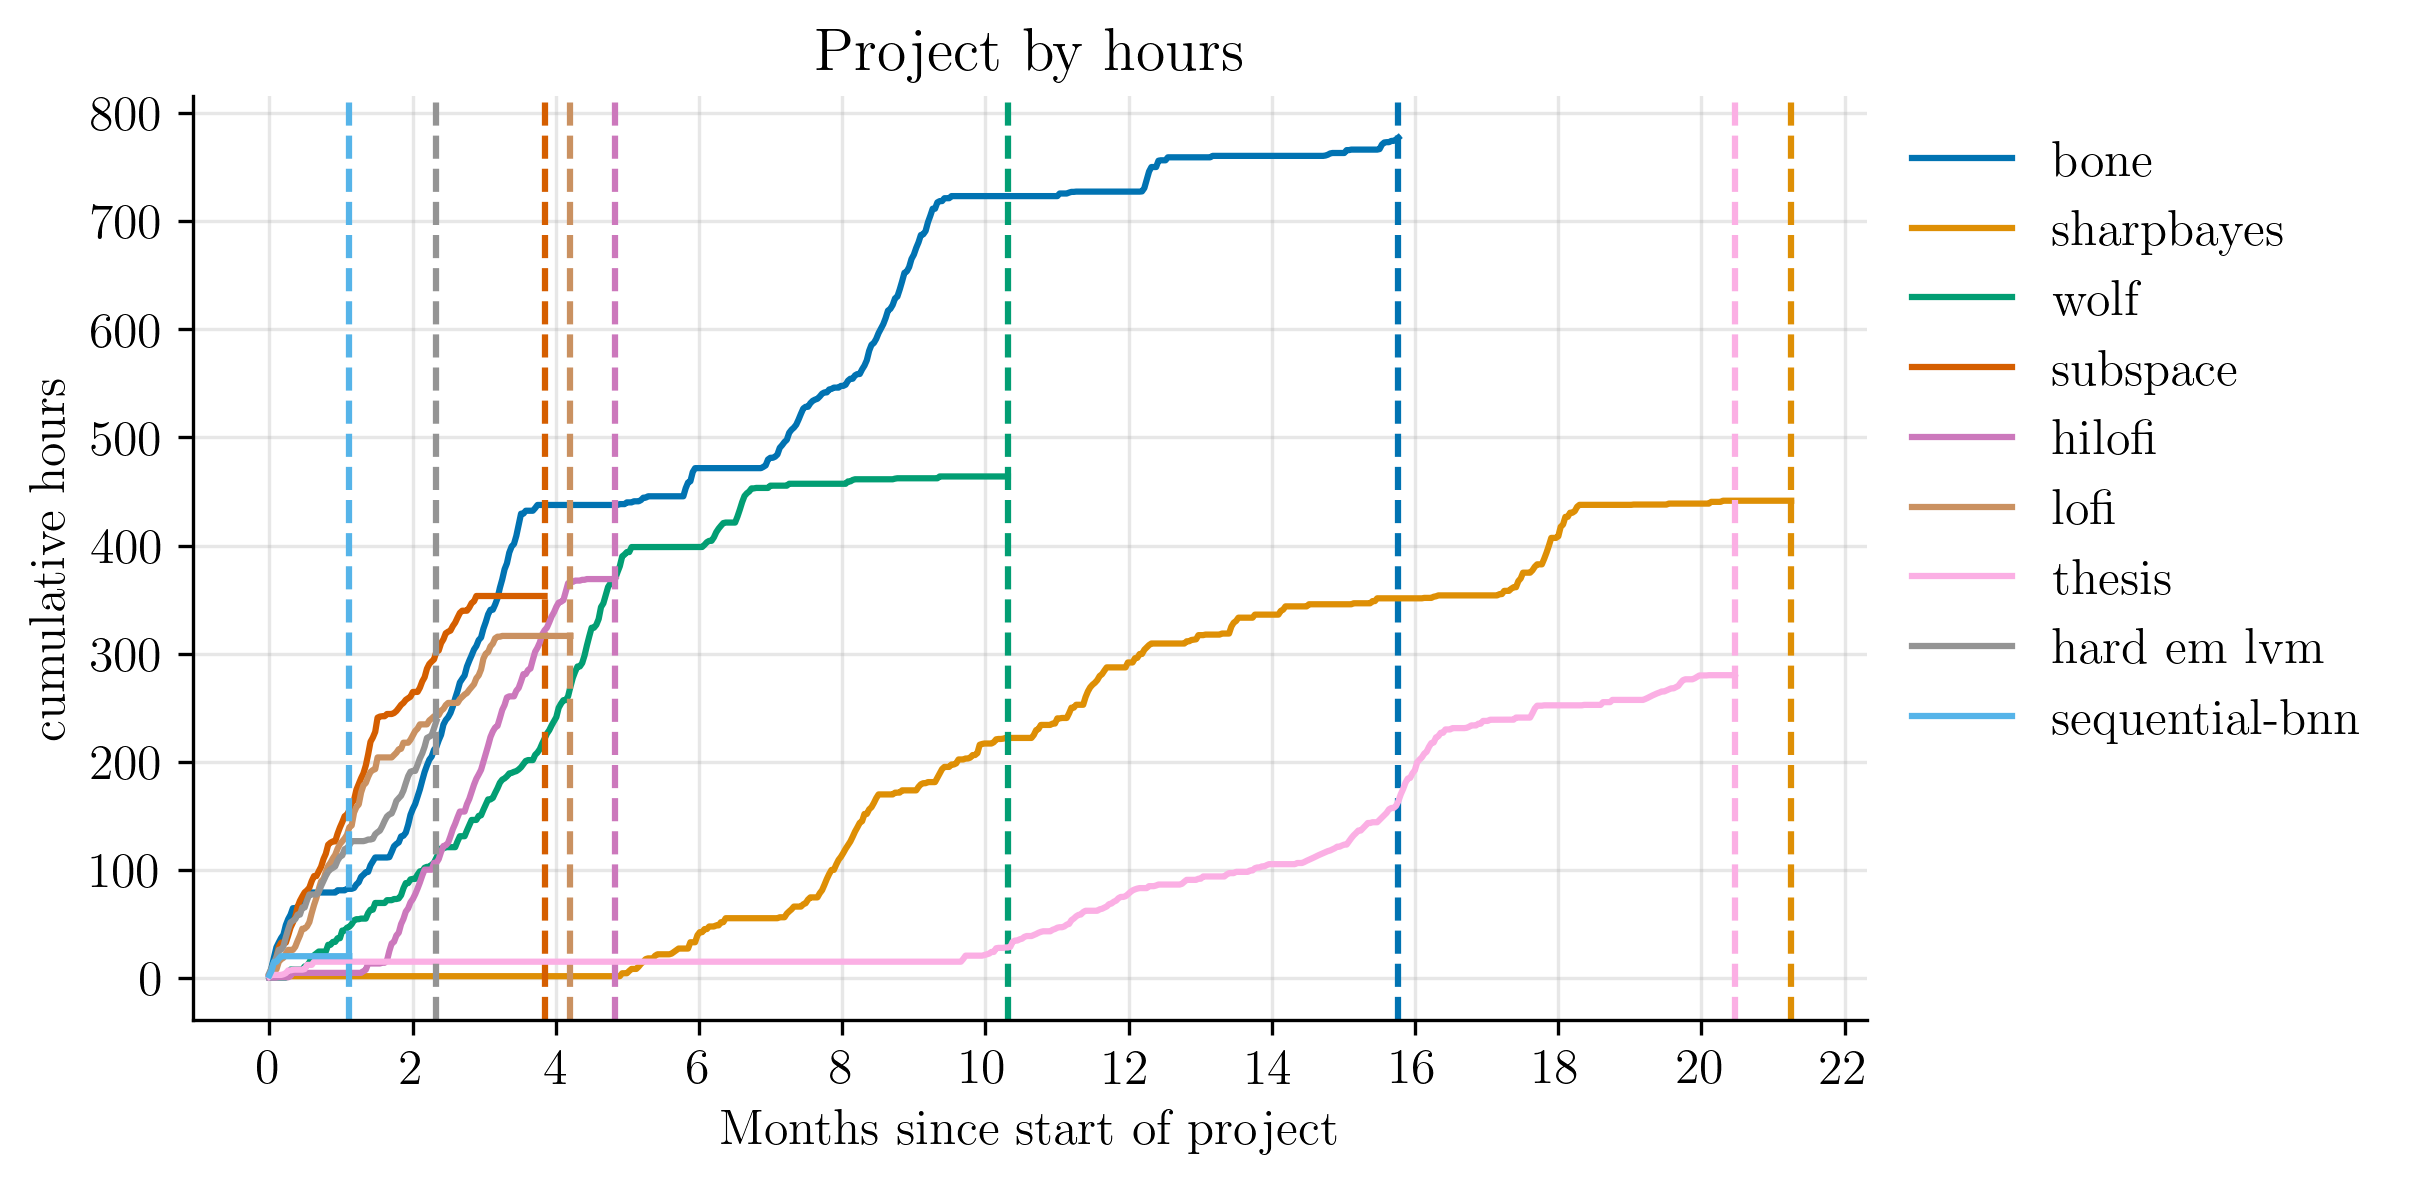
One way to visualise my relationship with ideas is to track the time spent on each project that began as a potential paper.
The plot below shows the cumulative hours invested in the various projects I started during the PhD. Some became published papers. Some led nowhere. Others remained in peer-review purgatory for extended periods of time.
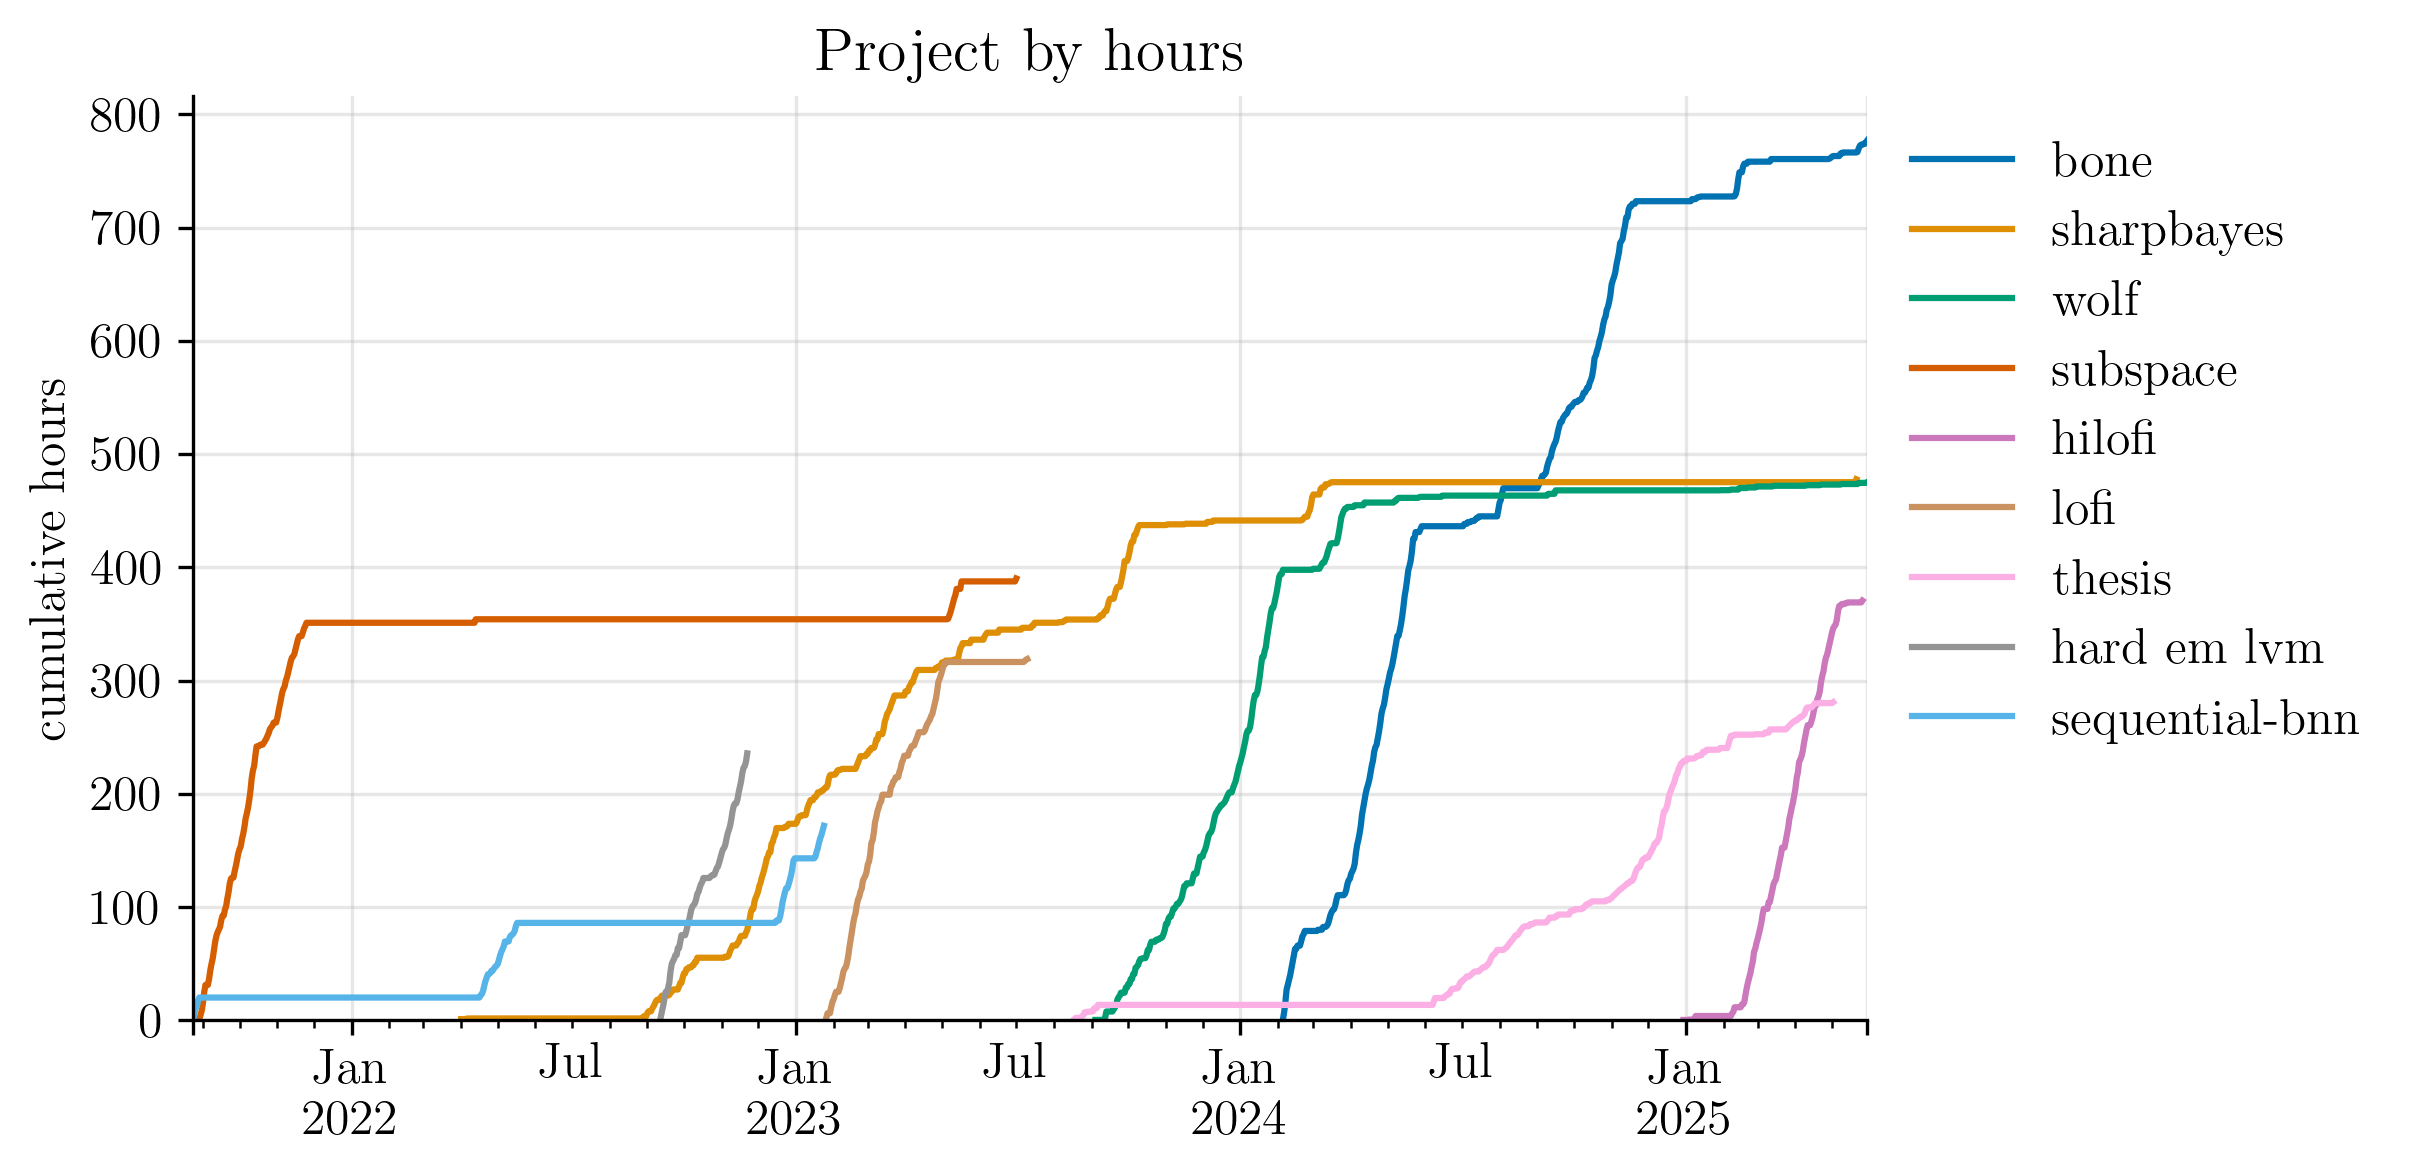
This plot summarises my path through the PhD. Each project tells its own story of failure or success, of long steady progress or short intense bursts of work.
The projects
Subspace
My first PhD project was subspace.
This was entirely proposed and supervised by Kevin.
It all started with a Slack message right after a summer project with him:
I just had an idea - basically a mashup of random subspaces […] for the DNN era […]
At the time, I did not have a clue what he was talking about. I wrote this in my logs:
I have yet to do more digging [sic] before I fully understand how to work with it, but so far it reads really interesting.
I eventually understood what he meant. This paper took around four months of work, and it got accepted to AISTATS. My first ever research paper.
sequential-bnn and hard-em-lvm
Soon after the paper got accepted at the conference,
and after spending some time at an internship learning about the real world,
I started to think I was a bit of a hot-shot researcher.
So I tried pursuing two new ideas on my own:
sequential-bnn and hard-em-lvm.
Both of them (unsurprisingly in hindsight) failed miserably. They made me learn the bitter lesson behind the sunk cost fallacy that Kevin always talked about.
Sharpbayes and LoFi
Around the time I gave up on these two projects,
I started working on my first journal paper:
the sharpbayes project. We ended up sending it to a mathematical finance journal.
Unfortunately,
it did not have enough obscure maths to be accepted,
it was outside the scope of the journal,
so we ended up sending it to a different journal, where it got accepted.
In this project, I got to experience the unnecessarily long peer-review process.
At the start of the next year, and a few months after
starting to work on the sharpbayes project,
I got to collaborate with different colleagues for the LoFi project.
The result was the execution of the ideas that I was not able to formalise on my own.
I realised during this project that
writing a paper is
much more engaging and productive if you work with people who truly care about a project as much as you do.
It ended up being published at the CoLLas conference.
There is an interesting contrast between the LoFi and the sharpbayes projects:
the former is the high-paced ML project with a nice conference as a reward;
the other
is
the slow-pace,
the more-about-the-journey-than-destination,
the you-forgot-a-comma-on-line-57 sort of paper.
WoLF
My second summer of PhD arrived, where nothing much happened other than reading a lot. Among all the papers read that summer was one that changed my view about what it means to be Bayesian. It had me thinking for days. So much so, that I ended up tweeting about it. As luck would have it, one of the authors of the paper saw my tweet and replied to it.
Thanks for sharing this! If you ever want to chat about anything generalised Bayes, just drop me a line.
— Jeremias Knoblauch (@LauchLab) May 22, 2023
I did ended up dropping him a line,
which was the spark of the next project: wolf.
Not that I have any favourite paper, but that has been the most fun I’ve had writing one. Time was tight but I was very excited. After a very arduous sprint of editing and code, it landed in ICML. For this project, I got to collaborate with some amazing colleagues. Some I even call my friends now.
BONE
Around the time I was waiting for the rebuttal phase for wolf,
I started to think about a new project: BONE.
This one was a lot of sweat and tears.
It was about an idea very important to me and
the reason I wanted to do a PhD.
We ended up submitting the first version to Neurips and got
two borderline accepts and one borderline reject.
Decision: reject.
After the rejection and some days off feeling sorry for myself, I decided to double down on the idea and rethink how to sell the paper. As a friend would say, “skill issue, bro”. So, I worked on it a lot more based on the reviewers comments and new ideas that came up during the rebuttal process. We ended up sending it to TMLR, where it was accepted.
Although it was the paper that took the most amount of time, care, and commitment, it flew under the academic radar. Or rather, it did not have as much impact as I thought it would. Sadly, I learned that hard work is not enough; many times, it also helps to have luck.
While at first I felt disappointed, I’m okay with it now. I’m glad that I got to write this paper and I like that I keep going back to the ideas in this paper every once in a while. At least it had an impact on me.
HiLoFi
Soon after finishing BONE,
I had to submit my PhD thesis,
complete the viva and graduate on time.
To me, that was mostly paperwork and waiting.
So, to pass the time, as one usually does,
I started to work on my first post-PhD project: hilofi.
This was my second attempt at Neurips
and my first attempt at taking something that was designed for purely for statisticians and apply it on ML.
I’m glad to say that it was accepted at Neurips.
Looking back, I learned so much from each project. Not only stats and ML but on how to do research, the importance of trying, the lessons of failing, and the joy of writing.
Papers, papers, papers
An important part of my PhD was reading. A lot of it. I know some of my colleagues despised this aspect (the more mathematically inclined ones). To me, reading papers was one of the most satisfying parts of doing a PhD.
I first started reading research papers in an unorganised way. I would try to read a paper cover to cover, trying to pay attention to unnecessary details, take the writing as truthful even if it was a pre-print on the arXiv. Over time, reading became less about the details and more about the big picture, trying to get the gist of it, and questioning the authors’ claims. It was at that point that it made sense to follow the usual advice on how to read papers, which suggests doing three passes and all that. 8
I tracked the papers that I read (or intended to read) in a reading list. As a rule, papers went to the reading list if I had at least read the title and the abstract. Papers that I wanted to read, but did not meet this criterion remained open tabs in my browser.
While adding papers to the reading list, I found myself implicitly classifying them into one of two camps: those that I read for research and those that that I read for pleasure. Of course, these two groups are not mutually exclusive.
The first camp consists of papers that more or less argue something I wanted to say. This makes the work scientific: building on what others have already thought about. They are also helpful to make sure that you’re not reinventing the wheel or, in the case of ML papers, benchmarks. Because, of course, my method is harder, better, faster, stronger than yours.
The second camp consists of papers that are a joy to read. These papers typically influence how I think about ideas and how I formulate new problems or methods. These range from a new framework rethinking what it means to be Bayesian to a conference paper that simply introduces a new method.
The figure below shows two time series of my reading list. The top panel shows the number of papers added per month, and the bottom panel shows the total size of the reading list.
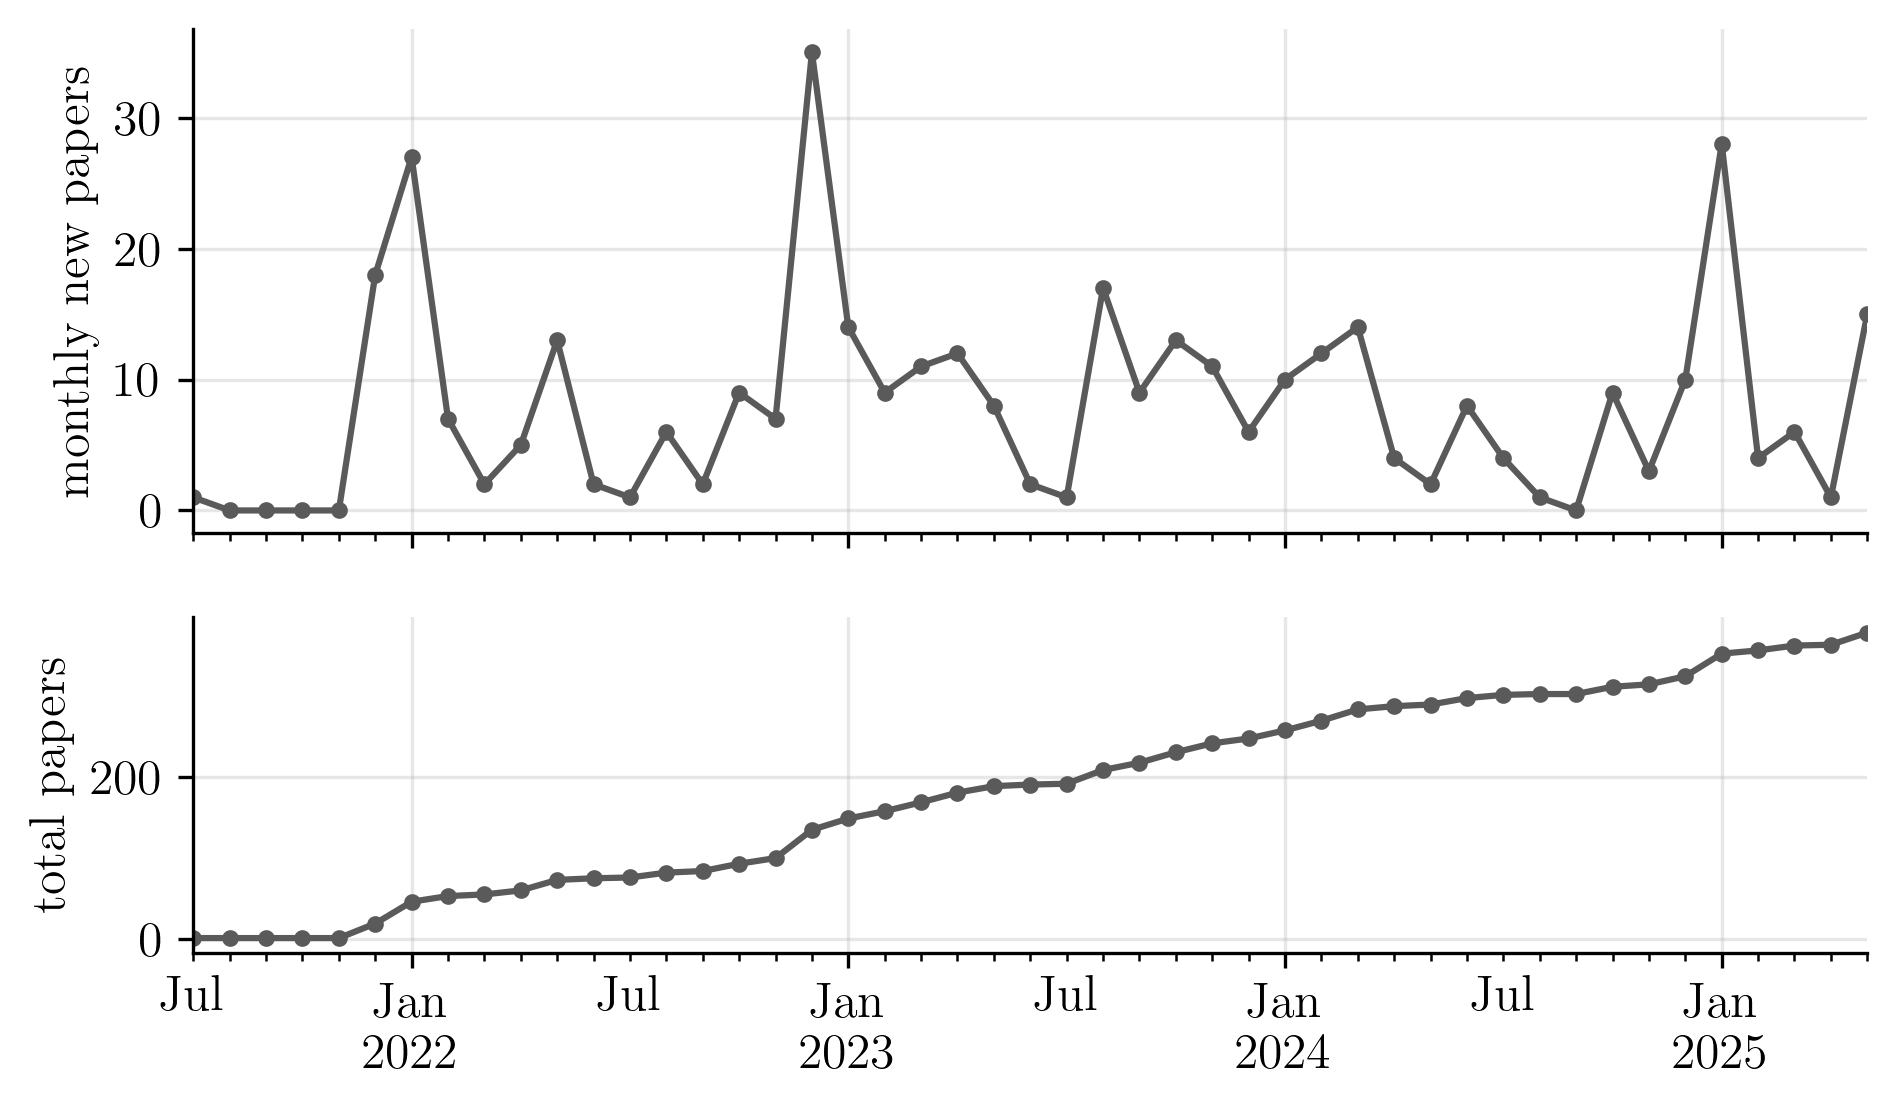
It shows that the first months of each year are when I added the most papers.
A friend of mine used to joke that I only read state-of-the-art papers from the 50s. What he didn’t know was that the Kalman filter was created in the 60s, so his statement could not possibly be true. Still, I do like reading vintage papers. Unfortunately, to my friend, the figure below, which plots the number of papers in the reading list aggregated by year, shows that vintage papers were not the main source of my reading.
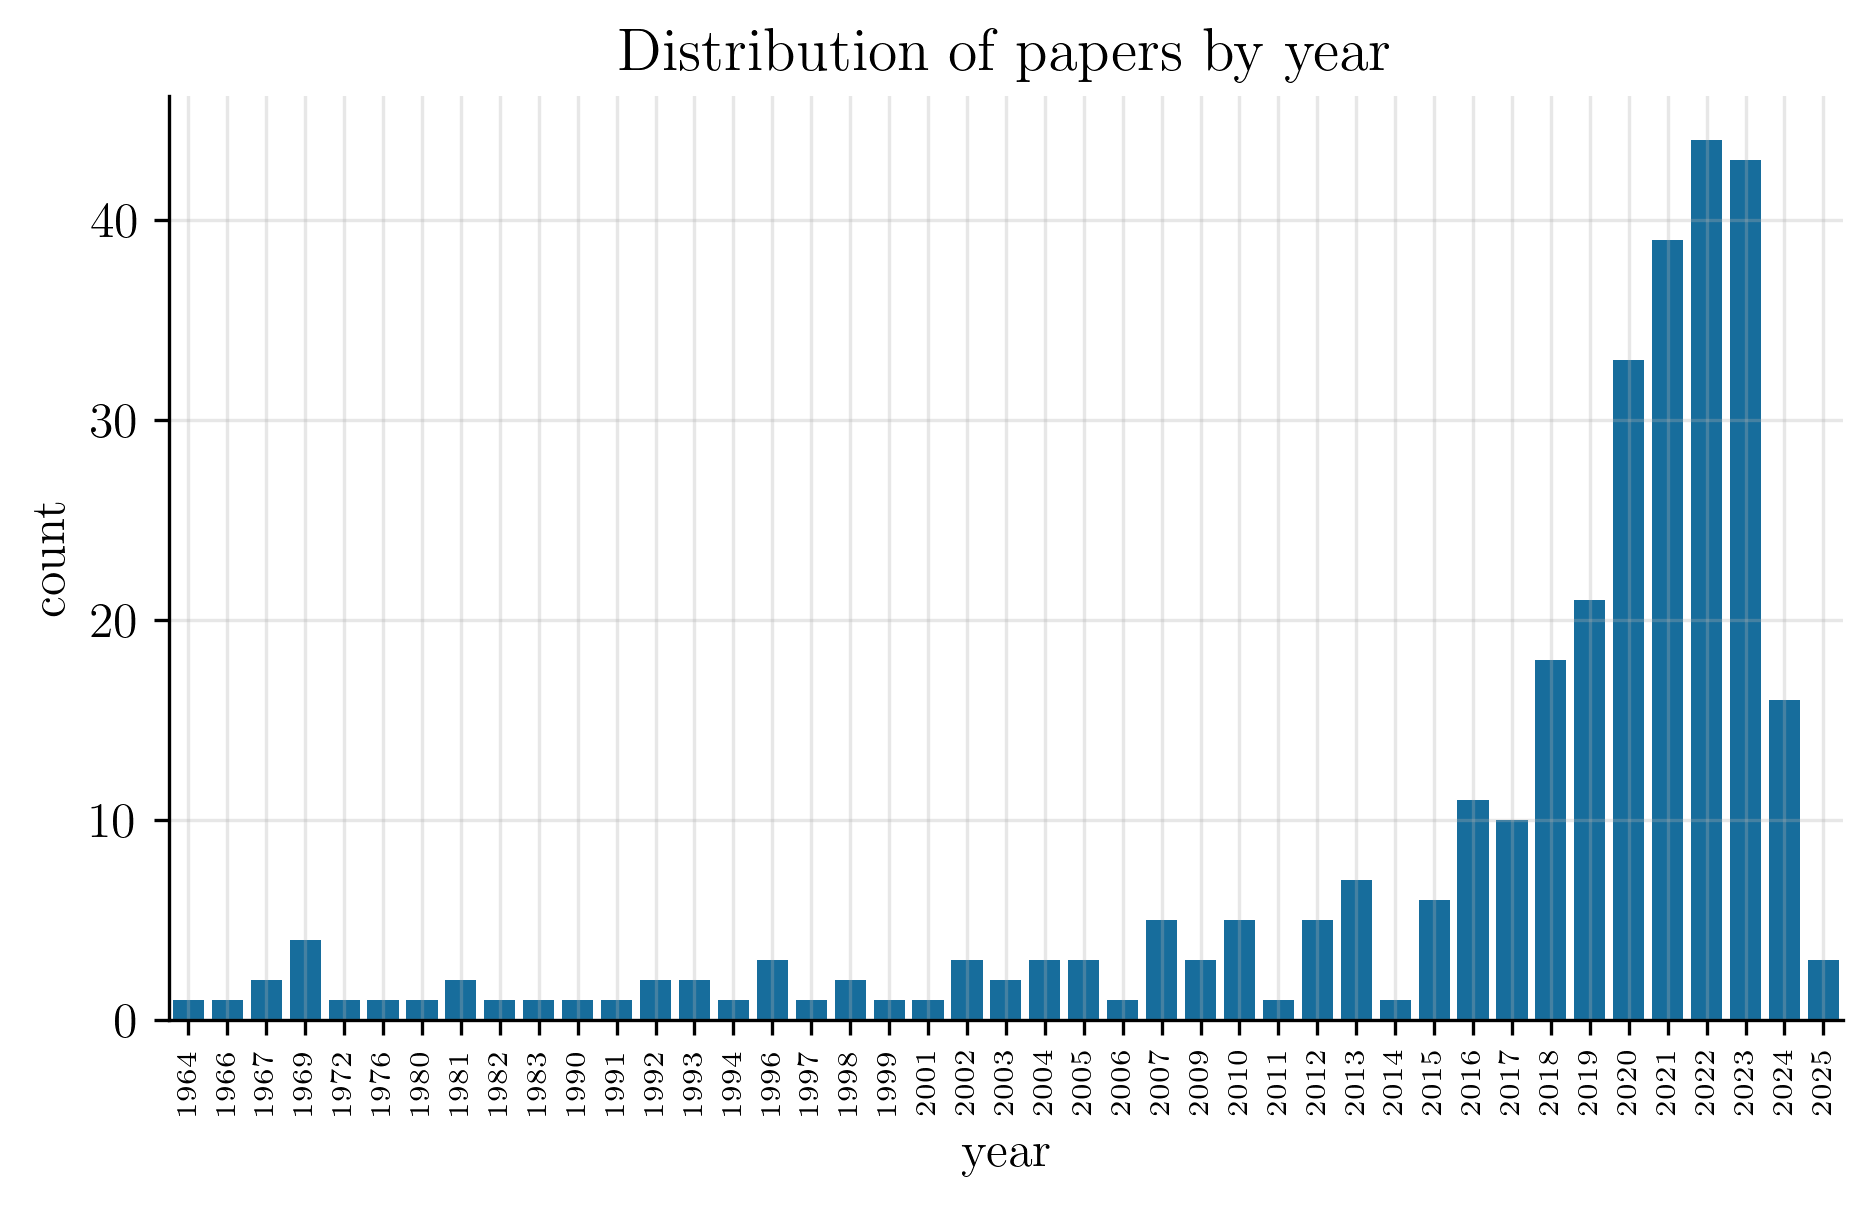
Alternatively, the following table shows the number of papers aggregated by decade.
| 1960 | 1970 | 1980 | 1990 | 2000 | 2010 | 2020 | |
|---|---|---|---|---|---|---|---|
| count | 8 | 2 | 5 | 14 | 21 | 85 | 178 |
Reflections, speculations, and a goodbye
I started the PhD believing that academia was the pinnacle of meritocratic institutions, that you earn the right to be here by working hard and being smart.
Over time, I realised that academia is a game of hard work, but even more timing and luck. This is not to say there aren’t brilliant people everywhere. Rather, at some point the differences between you and your peers become so small that those who move forward are the ones who know how to play the game, or who are simply lucky enough.
At some point, I saw myself among a group of hard-working, smart students, all striving to succeed. Yet what ultimately tends to move someone forward on the academic ladder is often having the right connection, the right supervisor, or the right idea at the right time.
I write this as someone who did the hard work, but also had a great deal of luck. I was lucky to be in the right place at the right time, to meet and work with people far more intelligent and experienced than I am. They taught me how to navigate this complicated landscape and how to do research. They advocated for me despite my lack of a prestigious background. And they introduced me to people, who introduced me to people, who introduced me to people.
Soon after finishing my PhD, I started a postdoc believing I had everything I needed to build an academic career: hard work, plus a bit of luck.
Not long after, I found myself thinking less about the ideas behind the research and more about the impact. The goal became publishing in prestigious journals, or maximising the number of papers. I began worrying about the order of names on papers; about whether I was publishing enough, writing enough grants, teaching enough; about citations, and about people not citing my work.
At the same time, the academic landscape was changing rapidly. Next-token predictors, so-called LLMs, were suddenly reading, writing, and even thinking alongside us. They promise faster and more productive research, but at the potential the cost of caring less about the details, greater pressure to publish before someone else does, and a growing sense of uploading a paper to the arXiv once is good enough.
I was sold the idea that riding the changing tides, enduring the pressure, the job insecurity, and the low salary, would all be worth it to eventually earn the coveted, tenured professor title. At that point, the story goes, you get to do what you want, when you want. You happily pursue your own research and work on your own ideas.
But this idea became hard to buy when I found some professors at top universities disgruntled with their academic legacy. They were at the top, yet still seemed they needed everyone else around to know it. Some pursued trends rather than research, hoping to stay relevant, but not necessarily because they cared about the research. Others pursued their own niche work, yet seemed bitter that the new kids on the block had not cited their obscure paper, which could be interpreted (if you squint hard enough) as an instance of their idea.
To be clear, I don’t think this is inevitable, nor representative of most of the professors I met. But it was a version of the future I could see for myself, which I now decide against.
I remember Alex once said to me that the PhD years were the best academic years. At the time I thought that he was joking. Now I understand.
I’m grateful for the experience of the PhD and the year I spent as a postdoc. I could not be where I am had it not been for the professors, postdocs, PhDs, and friends I met along the way. If the path and the outcome were more or less the same, I would do it again. But for now, I’m choosing a different direction. A new door just became ajar, and I have to go right in.
This became the two-year long process of studying Bishop’s Pattern Recognition and Machine Learning book. ↩︎
Brewin, Chris R., Bernice Andrews, and Laura Mickes. “Regaining consensus on the reliability of memory.” Current Directions in Psychological Science 29.2 (2020): 121-125. ↩︎
To be precise: 3 years, 9 months, 3 weeks, 7 hours, 39 minutes, and 31 seconds, but who’s counting? ↩︎
More precisely, for a given weekday, the median survival rate tells us the number of hours I’d be working at least 50% of the time. For example, if the median survival rate on Tuesdays is 6 hours, that means that on half of all Tuesdays, I work at least 6 hours. ↩︎
https://fortune.com/2025/03/17/elon-musk-doge-120-hour-week-sleep-productivity-health/ ↩︎
Keshav, Srinivasan. “How to read a paper.” ACM SIGCOMM Computer Communication Review 37.3 (2007): 83-84. ↩︎